
Poor Trader Dashboard 2026
A free, no-login decision-support dashboard for timing market risk and opportunity. It exists because the poor author cannot afford paid data feeds — so it scrapes free public indicators and stitches them into one panel that highlights when US equities look closer to a buy / bottom setup or a sell / top setup, while leaving the final call to the reader. Try the live webpage at poortrader.com. Source on GitHub: WENHA0ZHANG/poor-trader-dashboard.
The dashboard is laid out across four numbered pages.
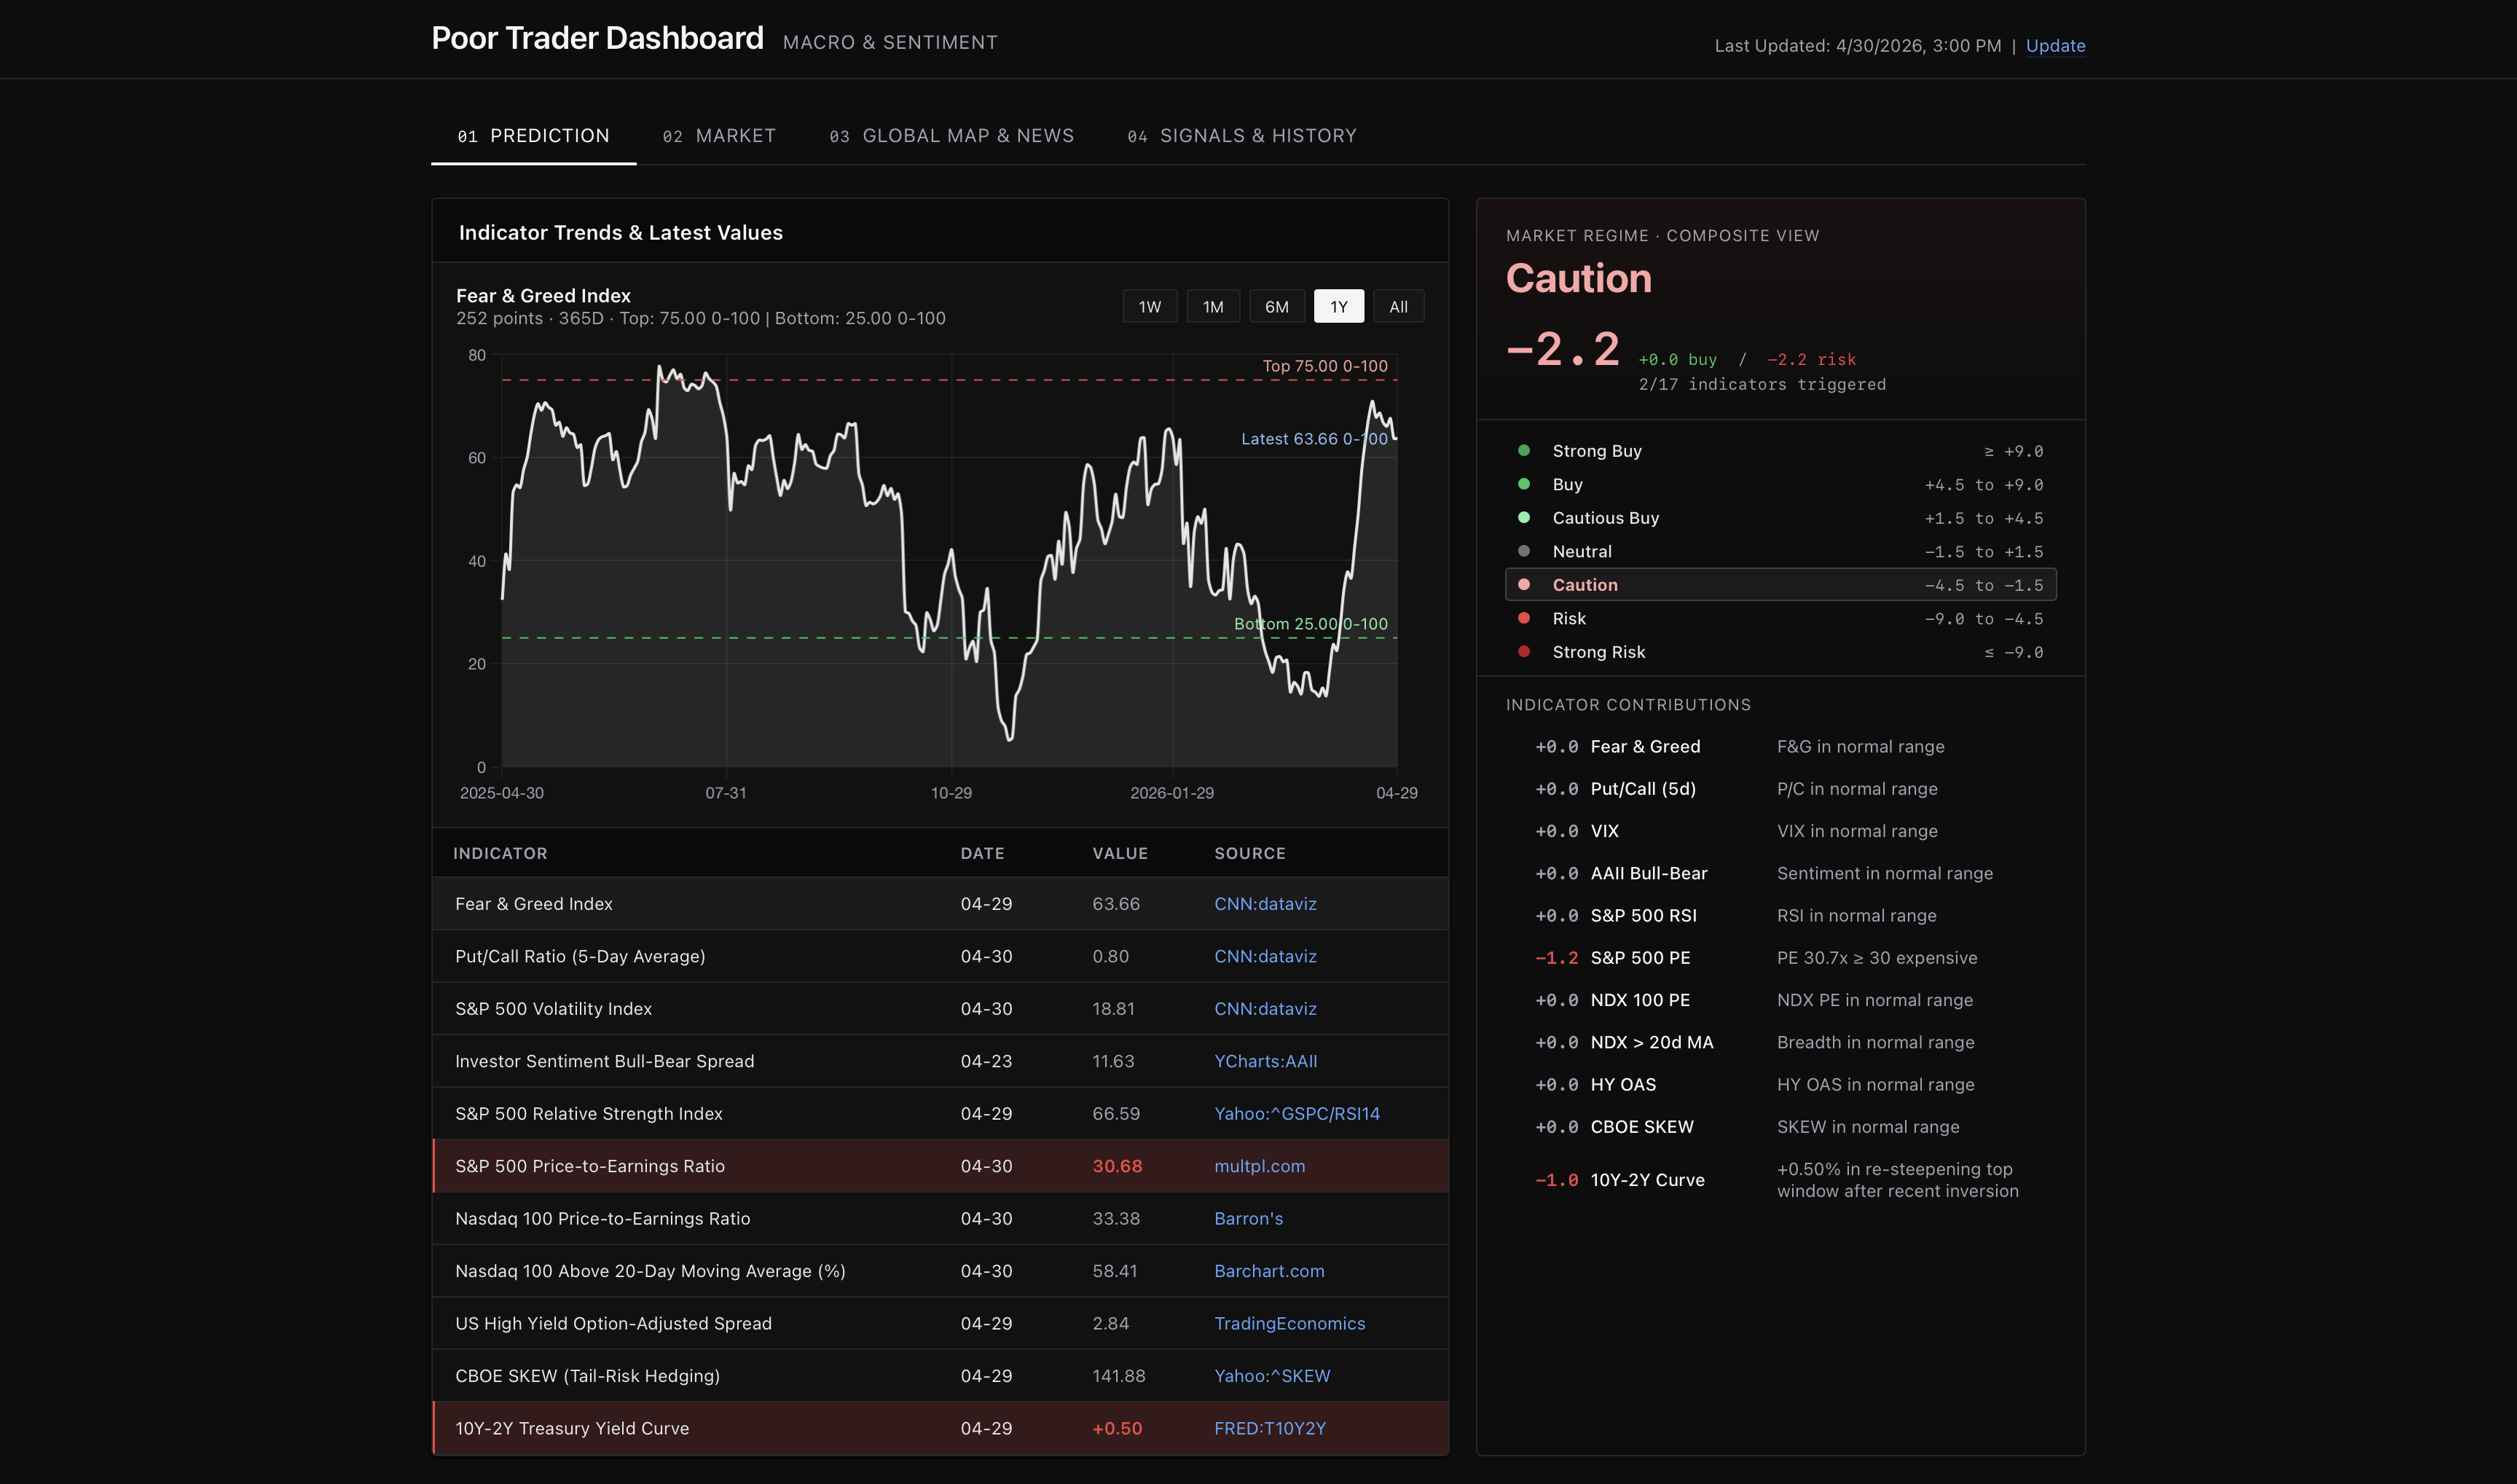
Page 01 · Prediction
The home page and the heart of the system. The left column lists every tracked indicator with its latest reading, top / bottom flag and source — clicking any row loads its full history with shaded extreme zones and per-point colored hover markers. The right column is the live Poor2Rich score: a signed number, the active regime (Strong Buy → Strong Risk), and a per-indicator contribution table that explains exactly which signals are pushing the market toward a buy or a risk reading.
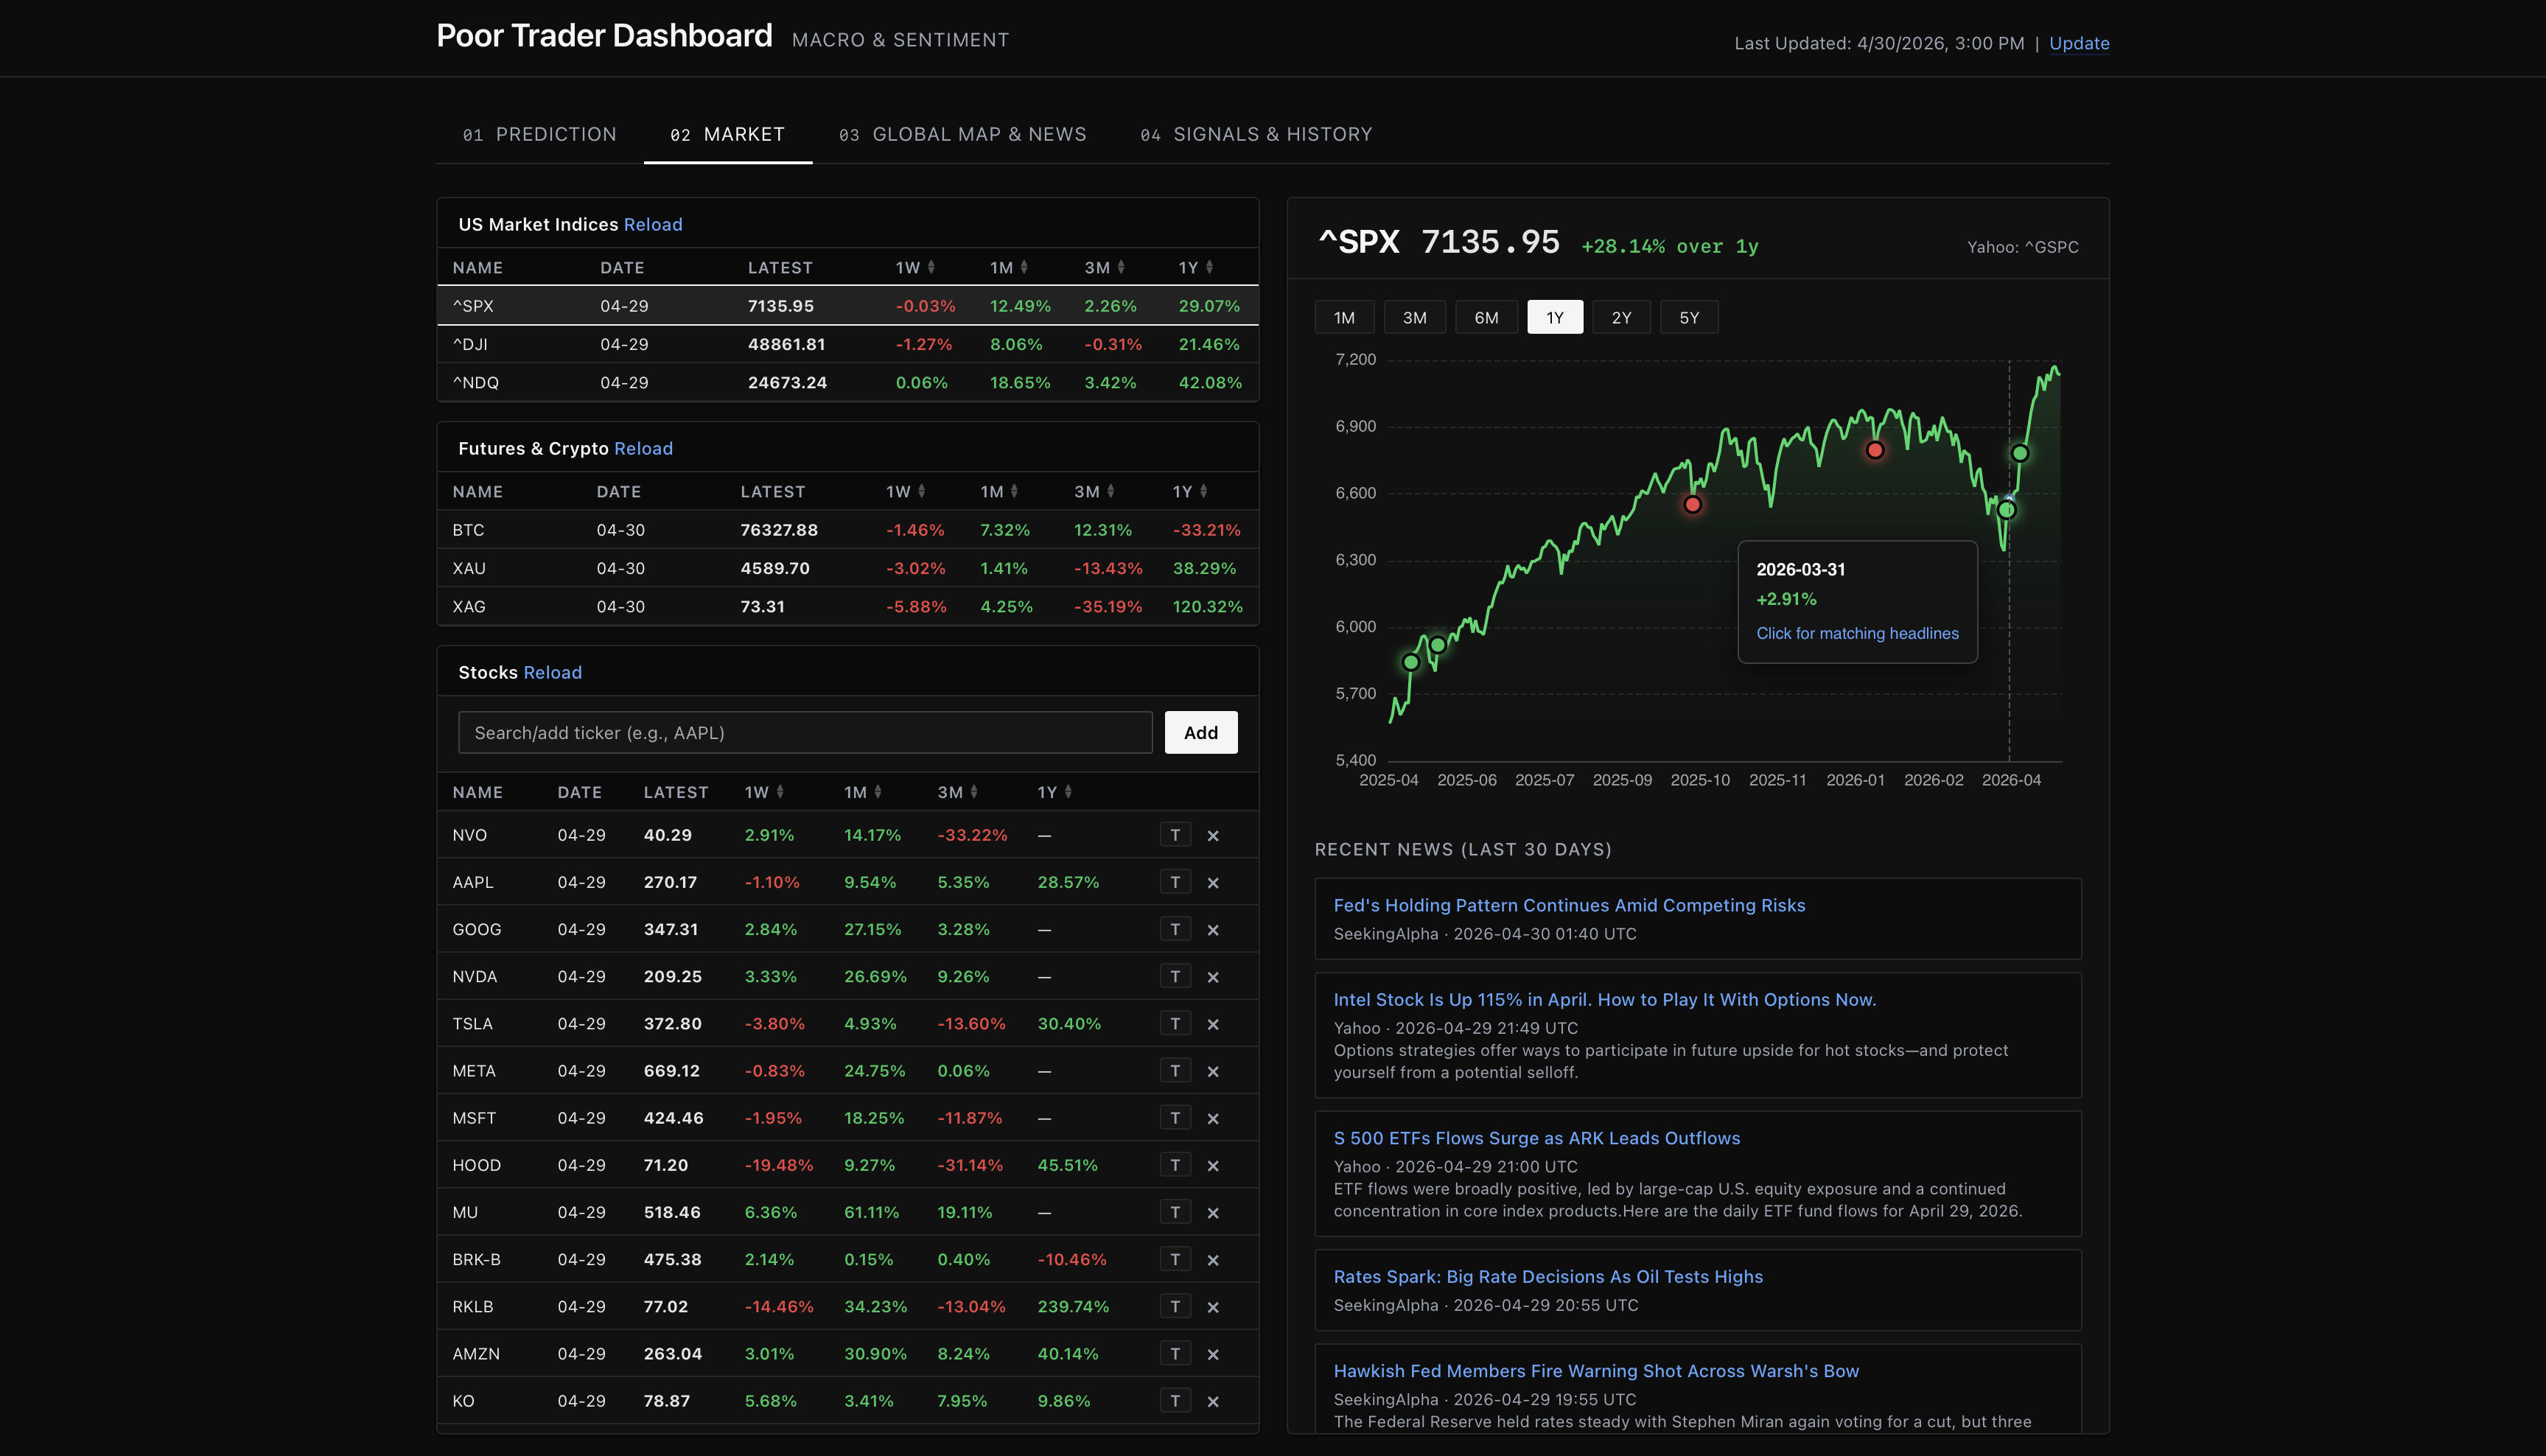
Page 02 · Market
Performance and watchlist tracking. Indices, futures and crypto, plus a fully editable watchlist with 1W / 1M / 3M / 1Y returns and sortable headers (descending → ascending → reset) on every period column. Clicking any stock loads a multi-range price chart with biggest-move dots — and clicking a dot reveals the news around that day, plus the most recent 30 days of headlines for the ticker. Watchlist additions, ordering and column sort persist in the browser, so the view is remembered across visits.
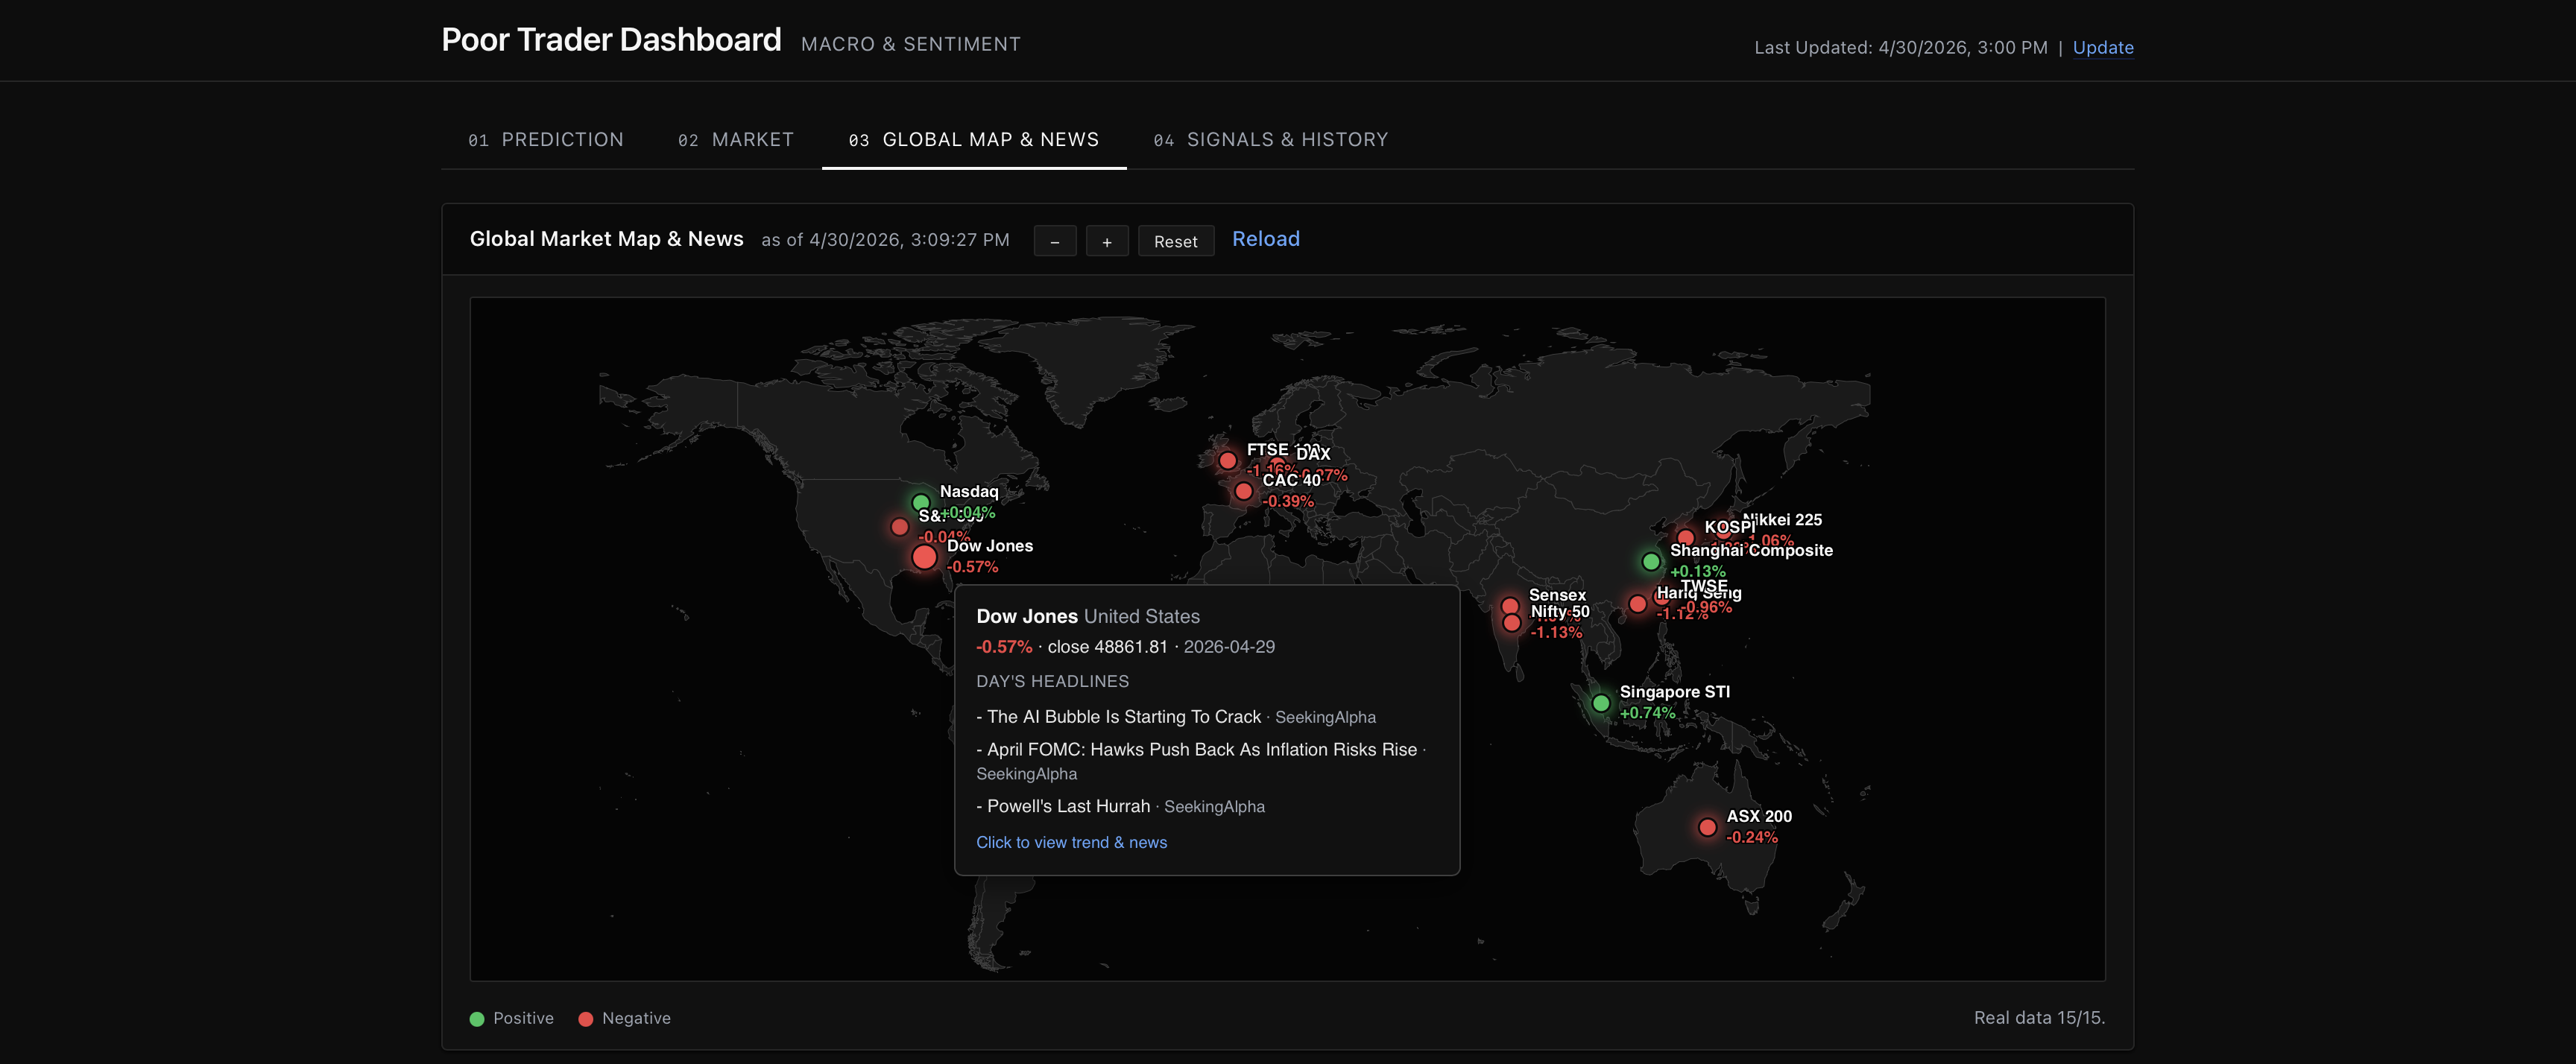
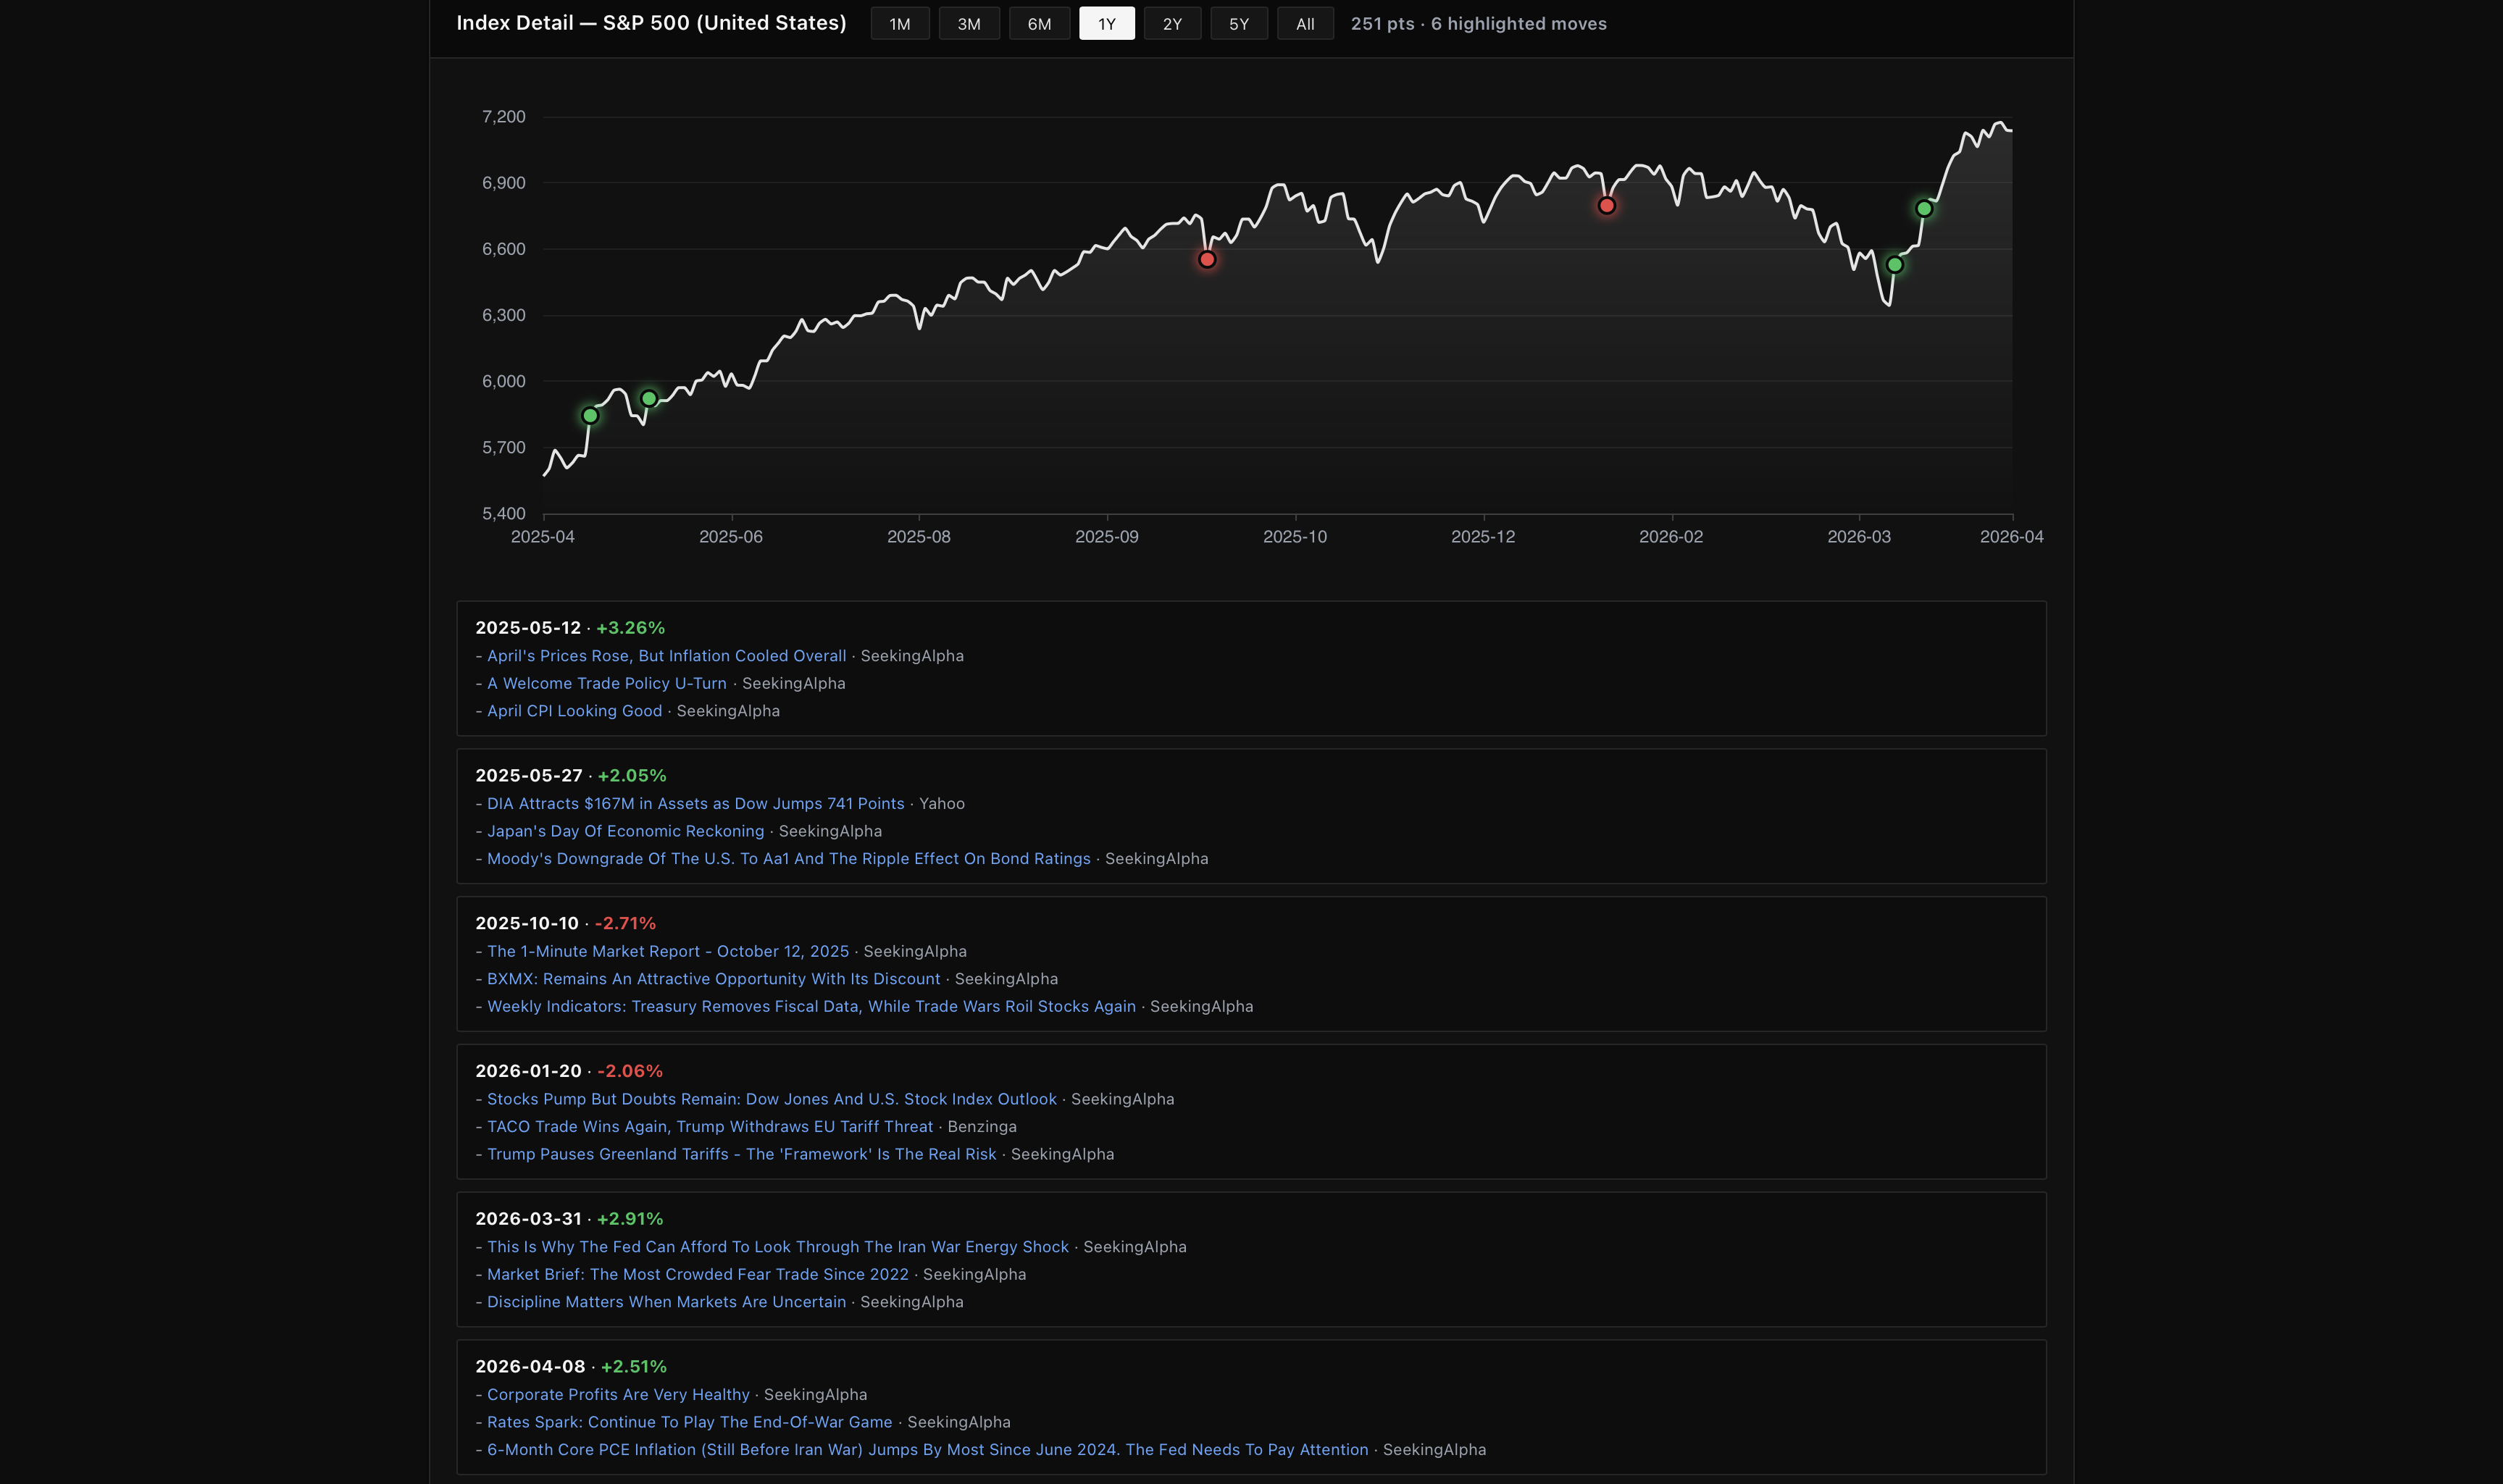
Page 03 · Global Map & News
The world view. An interactive map with colored dots for the major US, European, Developed-Asia and Emerging-Asia indices — hover a country for headlines, click to load that market’s full history. Significant moves are pinned on the chart so you can read what was actually happening on the days that moved the most. A general market news feed sits next to the chart to keep context close to the price action.
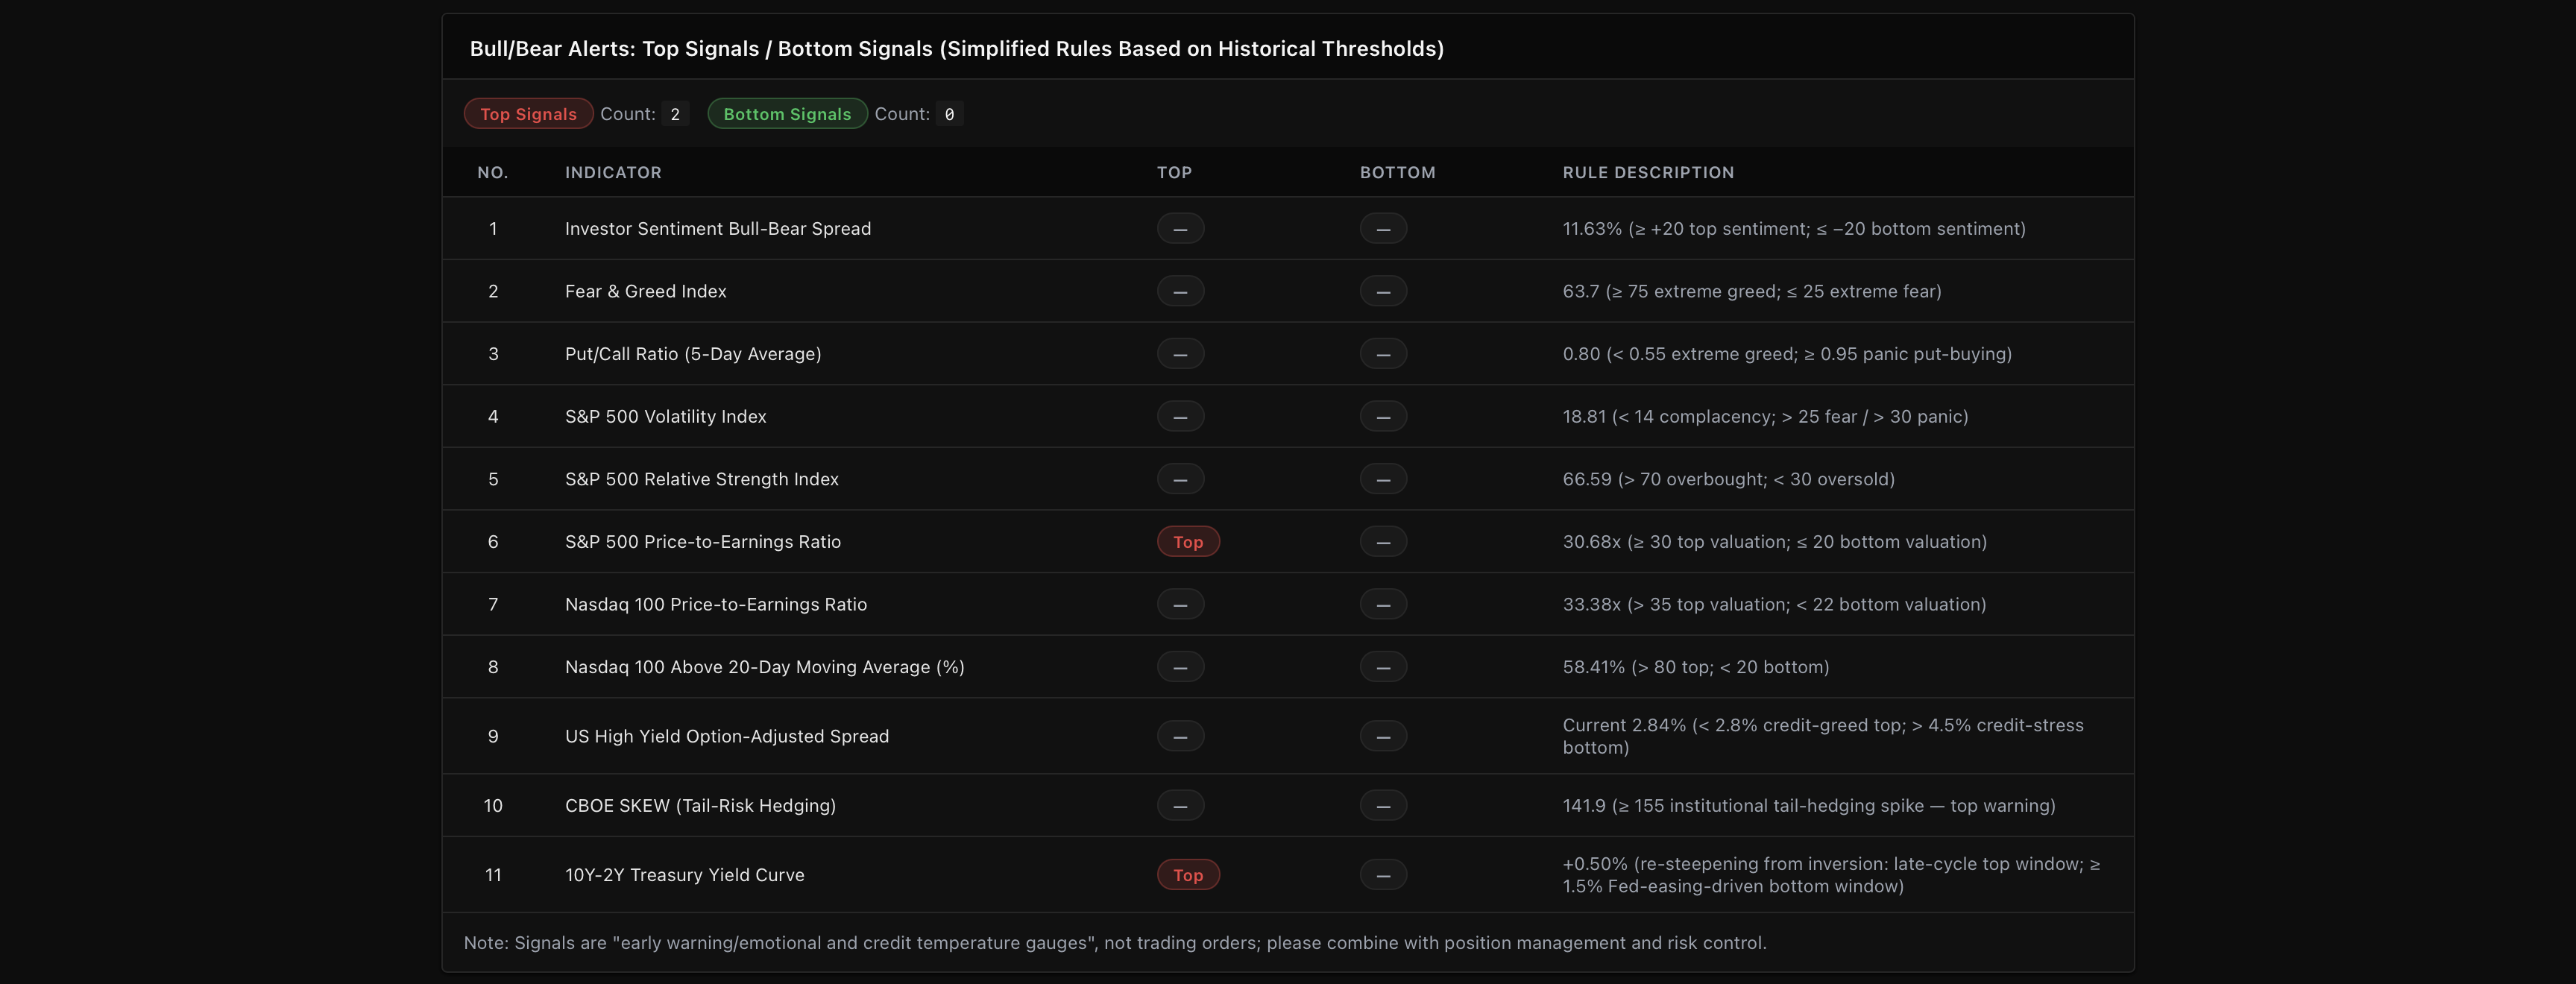
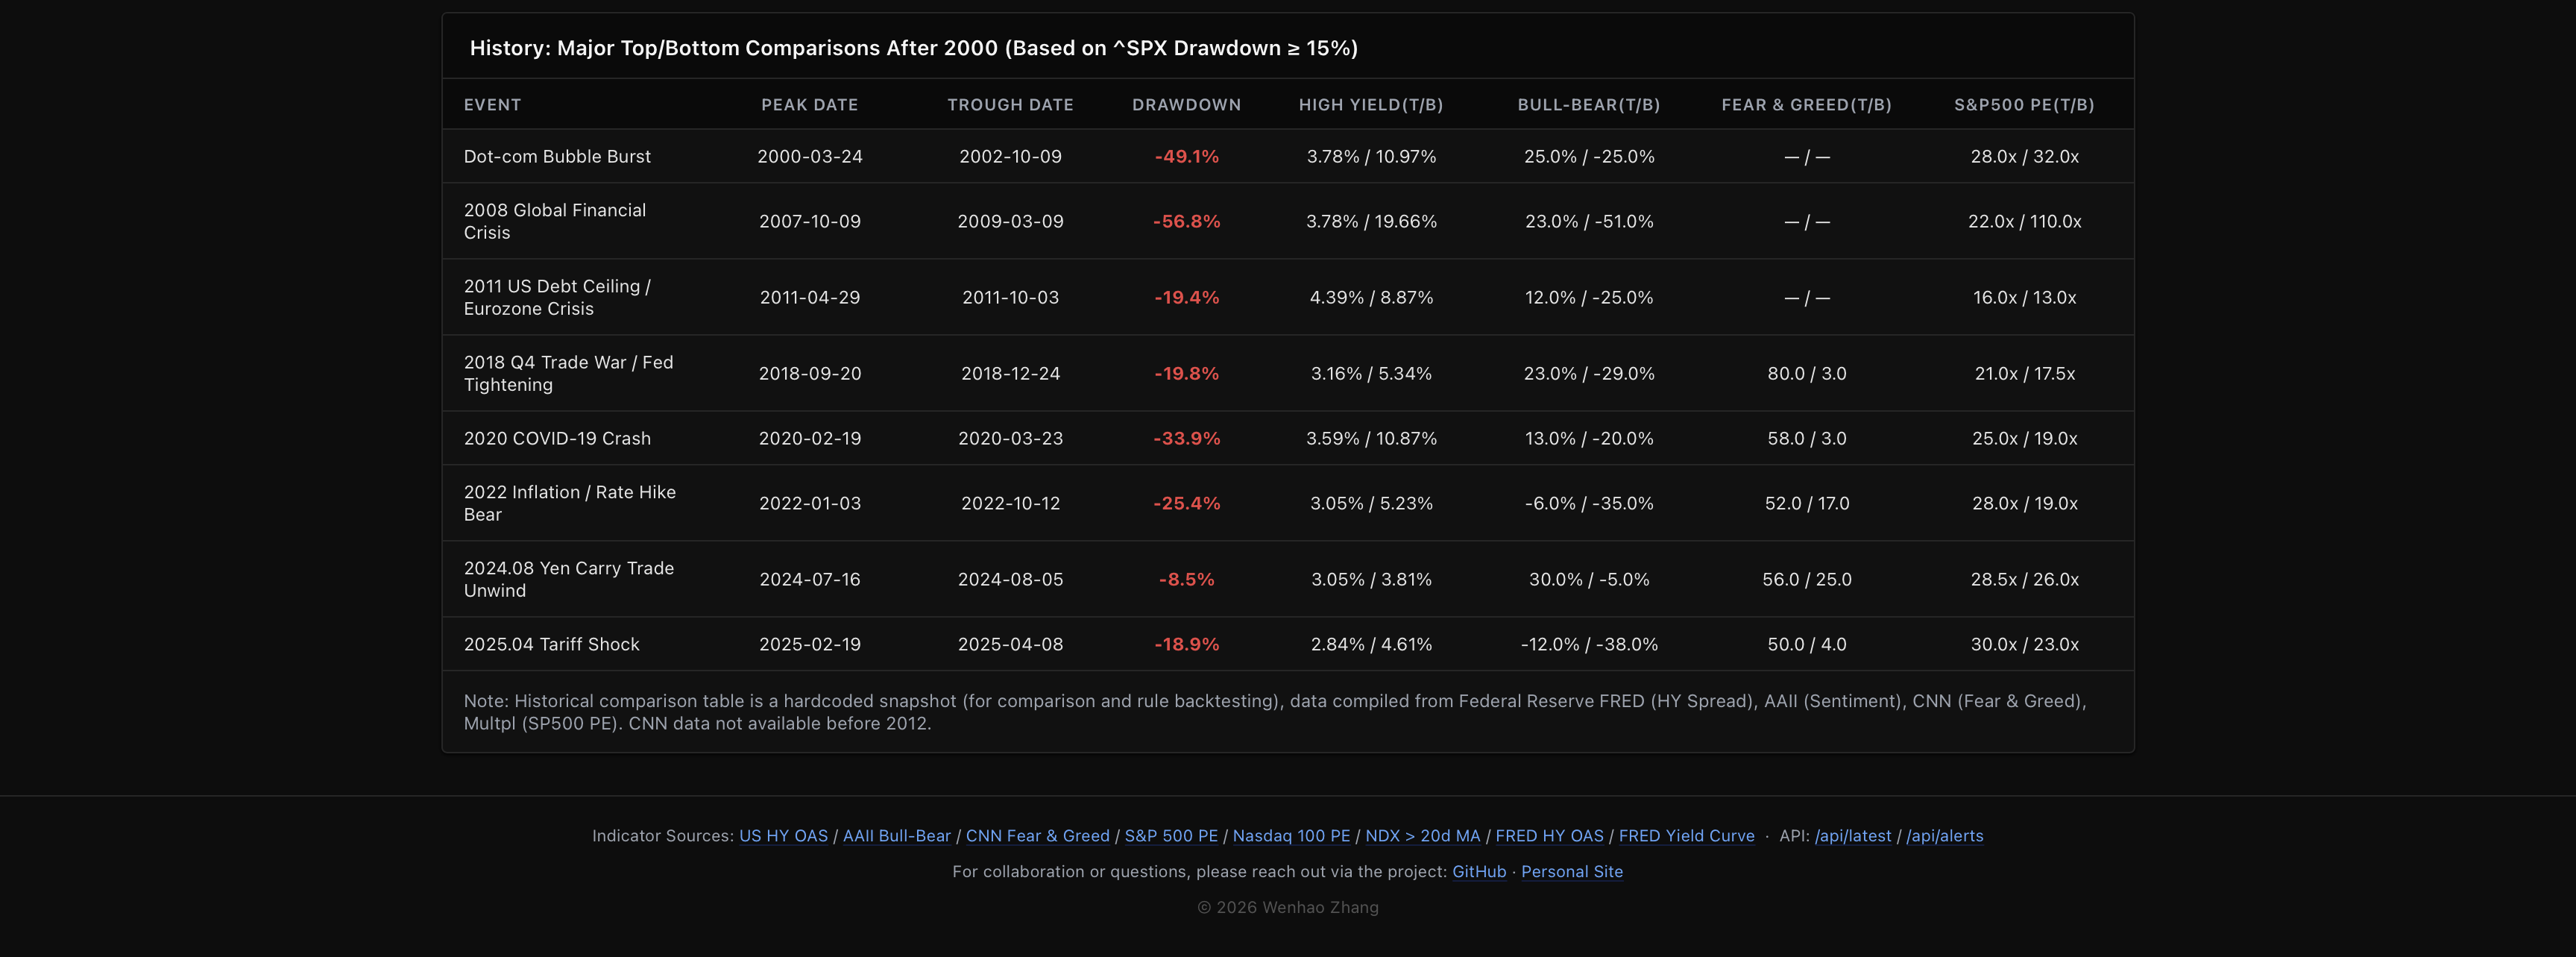
Page 04 · Signals & History
Rules and reference. The Bull / Bear Alerts table lists the simple per-indicator thresholds the dashboard uses to flag tops and bottoms, with a one-line rationale for each. Below it, the Historical Comparison table lays out every major US equity top and bottom since 2000 — Dot-com, 2008 GFC, 2011 debt-ceiling, 2018 Q4, 2020 COVID, 2022 inflation, 2024 yen-carry, 2025 tariff shock — with the actual readings of HY spread, AAII sentiment, Fear & Greed and PE at each peak vs. trough. Those numbers are the database the in-app thresholds are calibrated against.
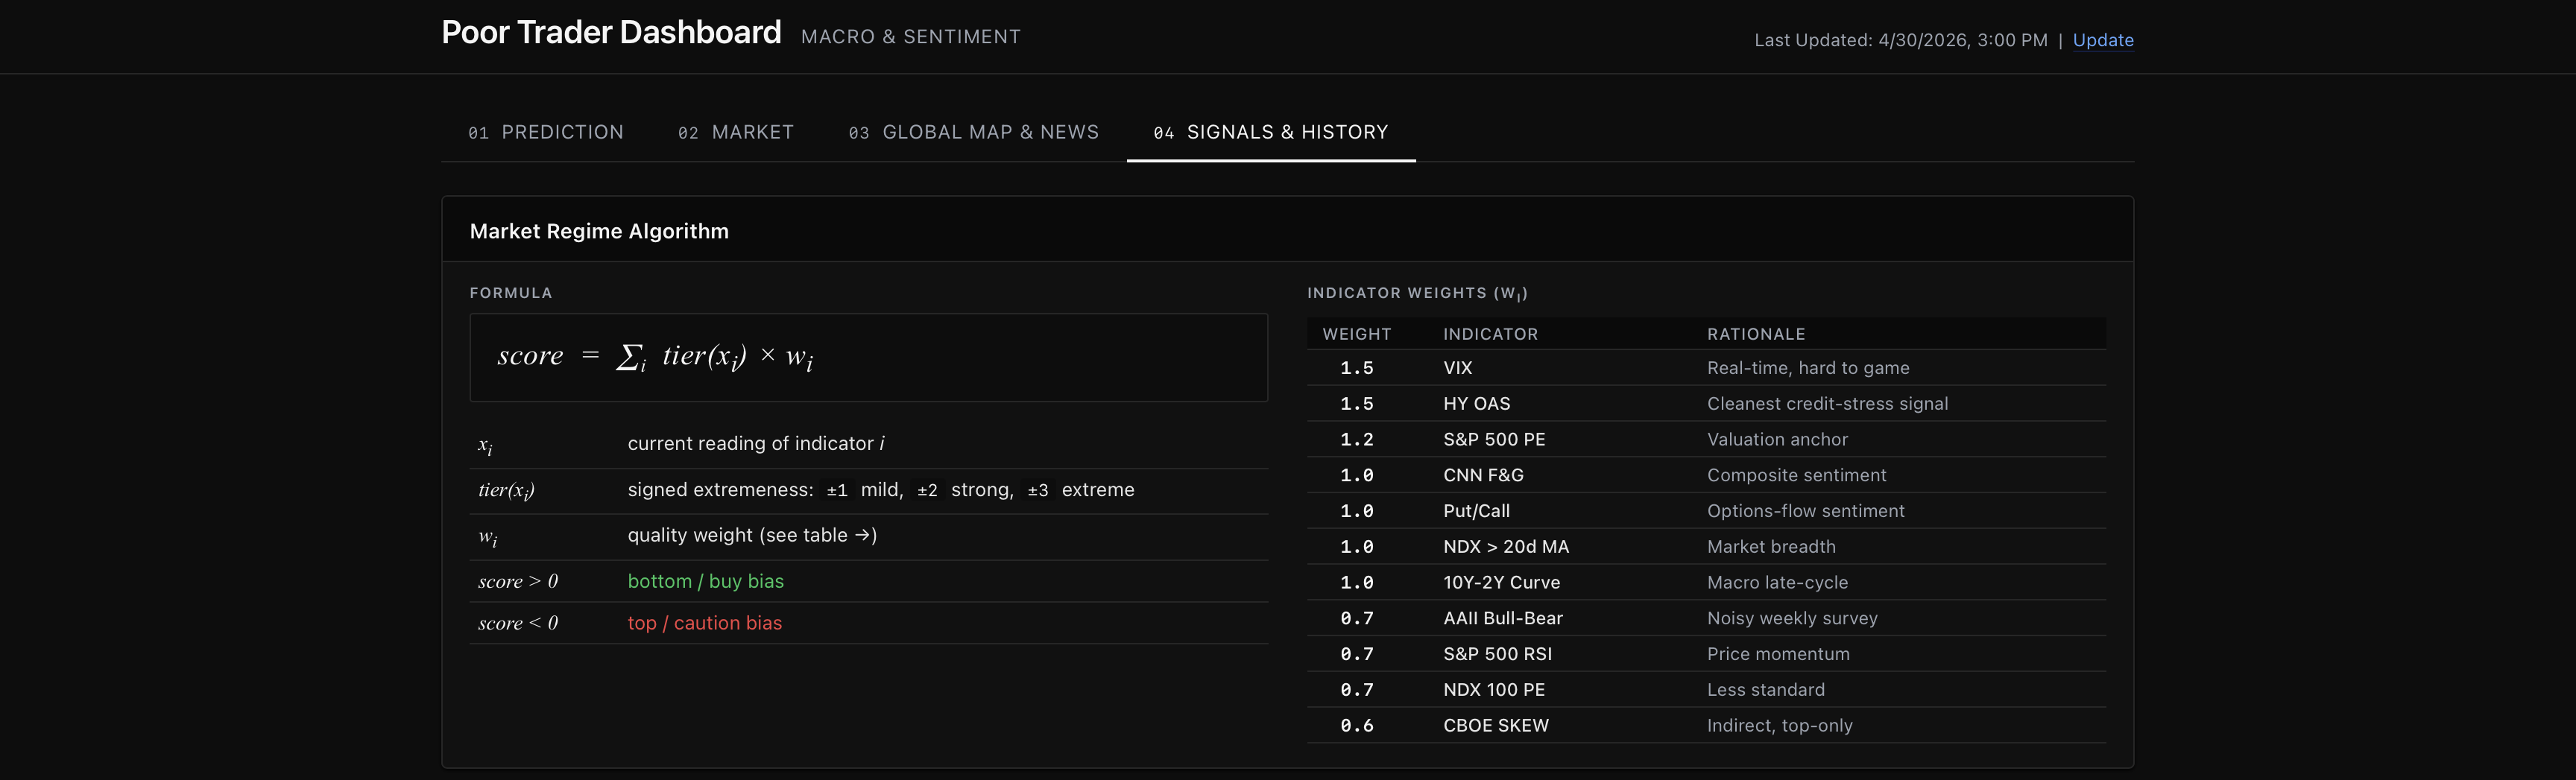
The Poor2Rich Algorithm
Most market dashboards either bury the user in dozens of unrelated charts or hand back a black-box number with no explanation. The Poor2Rich score takes the opposite approach. It picks a small group of indicators with strong historical relationships to major US equity tops and bottoms — VIX, US High Yield spread, S&P 500 PE, CNN Fear & Greed, Put/Call, Nasdaq 100 breadth, the 10Y–2Y curve, AAII bull-bear, S&P 500 RSI, Nasdaq 100 PE and CBOE SKEW — scores each one by how extreme its current reading is versus its historical thresholds (a signed −3 to +3 tier), weights them by how reliably the indicator has marked tops and bottoms in the past, and sums the result into a single signed score. Positive contributions push toward a buy / bottom bias; negative contributions push toward a top / risk bias. Every term is itemised on screen, so the score is never a black box: a “Caution” reading always tells you exactly which indicators were responsible for it.
A Top reading is treated as a sell / take-profit signal; a Bottom reading is treated as a buy / accumulate signal. Every threshold is derived from historical extremes around the major US equity tops and bottoms since 2000. Signal calls are logged with date and score, so the model can be verified against real market outcomes — not after-the-fact screenshots.
Disclaimer: this is a research / hobby project. The Poor2Rich score and bull/bear alerts are early-warning gauges of sentiment and credit temperature — not trading orders. Always combine with position sizing and risk controls. GPL-3.0 license.